Estimating the probability of winning the presidential election
National polls are somewhat meaningless if you are trying to predict who will become president in the US. This is of course due to the Electoral College, and the winner-take-all rules in almost all US states. What's much more useful is looking at state polls, and trying to combine those with the number of electoral votes that each state has, in order to help predict who will win the election.
One method is to combine state poll results with electoral votes per state in order to estimate the number of electoral votes each candidate will receive. This can be somewhat useful, but we are not as interested in exactly how many electoral votes each candidate will receive. That is, it doesn't matter if a candidate gets 272 or 324 electoral votes, all that matters is that they crossed the 270 threshold. So, we are more interested in the probability that a given candidate will win the election, that is, the probability that they cross the 270 electoral-vote threshold.
This website uses state polls and electoral vote totals for each state in order to estimate the probability of winning the presidential election, for each candidate.
Background
For each state, we have
- EV : number of electoral votes
- D : Percent of people voting Democratic, according to latest polls
- R : Percent of people voting Republican, according to latest polls
Probability of winning a state
In each state, whoever has the majority of the votes wins all EV's. This ignores the couple of states that have a different allocation of EV's, but they have a small number of EV's (4 and 5), so for the purposes of this approximation, it should be sufficient to lump them in with the winner-take-all states.
The probability that the final vote, i.e. the actual election, will give the majority to the candidate who is currently ahead in the polls, is a function of the current difference in the polls (i.e. D-R). If you have a 20% lead in the polls it is more likely that you will eventually win that state than if you have a 5% lead. The reasons why the current poll results give you only a statistical measure of how that state will vote are (1) inherent errors in polling data, and, (2) people might change their mind by the time the election is held.
The probability-of-winning-the-state vs difference-in-poll-results function should start at 50% for a zero difference, approach 100% as the difference approaches 100%, and approach 0% as the difference approaches -100%. This is reasonable, because, for a zero difference in the polls, there is a 50-50 chance that the state might go either way. Also, if the difference in the polls is very large, it is highly unlikely that the leader will lose that state come election time.
Of course, the issue is what should this curve look like? There are many possibilities, and two are shown in the figure below:
In the blue ("linear") curve, the probability of winning a state changes linearly with the difference in the state polls. The red ("step") curve takes a different approach: If the poll results are such that the difference is within 5%, then it's a statistical tie, and so the probability of winning is 50% for each candidate. If the poll results are more than 5% in favor of a candidate, then that candidate has 100% chance of winning that state.
Both approaches are a bit simplistic, but they do have some good traits, namely the linear curve is proportional to the state poll difference and the step curve has a nice "ignore" feature for small poll differences. Below we show a curve that tries to combine both traits, and is the one we use for our calculations.
The curve is tweaked by a parameter "alpha" and the figure below shows the shape of the curve for three values of this parameter. The one we use in our calculations is the blue curve. We see that it has a nice "ignore" feature for small state poll differences, it rises proportionally to the state poll difference after that, and then plateaus at 100% once the state poll difference hits 20%.
Probability of winning the presidential election
Now, given the above, we can construct the probability mass function (pmf) of the EV's that each candidate will receive. Let EV be the number of electoral votes a candidate will receive on election day. EV is a random variable which can be described by
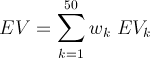
where EVk is the number of electoral votes in state k, and wk is a random variable that is equal to 1 with probability pk and equal to 0 with probability 1-pk (where pk is determined based on the polls from that state, as described in the previous section).
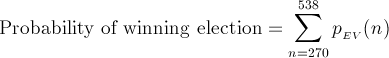
There is a way to get a closed-form solution for the pmf of EV, which means that we have a way of calculating pEV(n), that is, the probability that EV equals n, for any n between 0 and 538 electoral votes. This in turn implies that we can calculate the probability of winning the election as follows:
Results
Using daily state poll data from electoral-vote.com, we calculate the probability that each candidate will win. We originally did this back in 2008 and have applied it to all elections since then. The methodology was also retroactively applied to the 2004 election using available state polls.
In all elections except 2016, the calculation correctly predicted the winner, having a predicted probability of winning of at least 70%. For 2016 the candidate who ended up winning had a predicted probability of winning of around 27%.
- The results for the 2004 US Presidential Election, between Bush and Kerry are here.
- The results for the 2008 US Presidential Election, between Obama and McCain are here.
- The results for the 2012 US Presidential Election, between Obama and Romney are here.
- The results for the 2016 US Presidential Election, between Clinton and Trump are here.
- The results for the 2020 US Presidential Election, between Biden and Trump are here.