 Reddit
| Tweet | Reddit |
| Date | Probability of winning | Number of electors |
|---|---|---|
| June 21 | Biden 34.9%, Trump 65.1% | Biden 251, Trump 287 |
| June 14 | Biden 44.9%, Trump 55.1% | Biden 261, Trump 277 |
Below is a plot of the probability of winning the US presidential elections in 2020 based on state poll results.
Take the estimates with a grain of salt for many reasons, including that this year promises to be an unprecedented election which will likely end up being a quagmire. So, it's not clear how predictive the polls are this time.
For methodology and detailed predictions of presidential elections going back to 2004 see sections below.
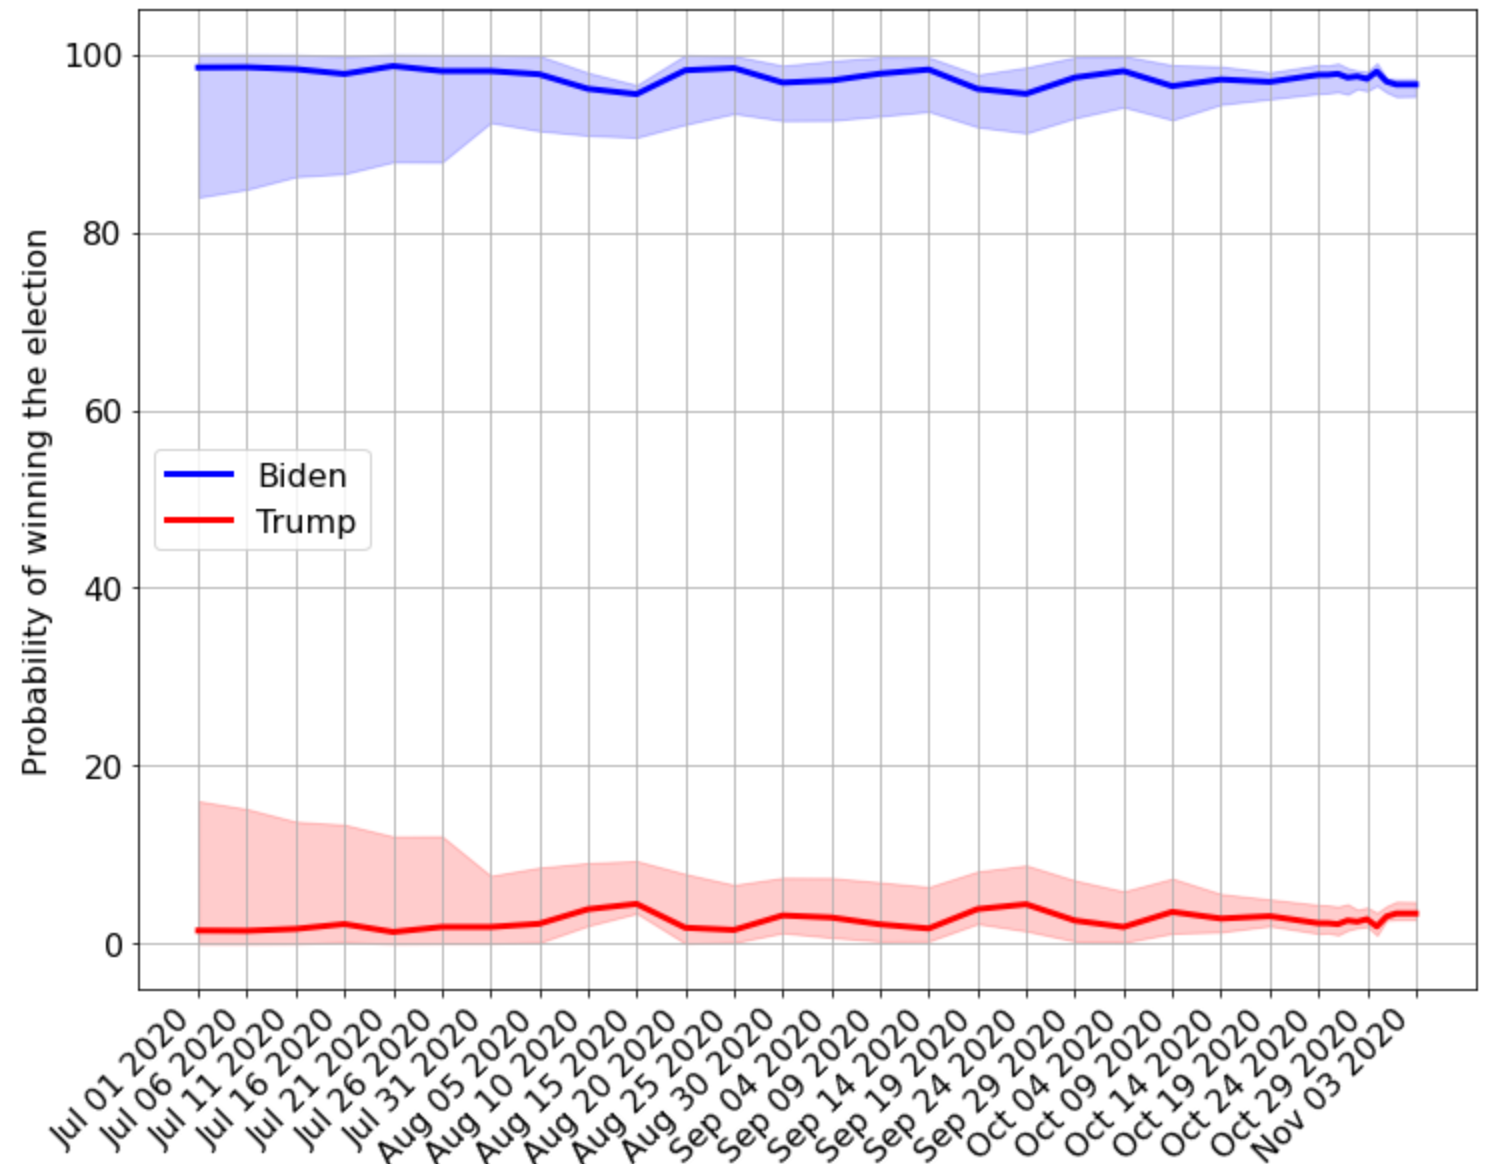
Compared to previous years, the predictions for 2020 are remarkably stable over time. Perhaps because people know both candidates very well, the political environment is polarized, and people are set in their decisions. It would take a huge event to move things by the same amounts we saw in previous elections.
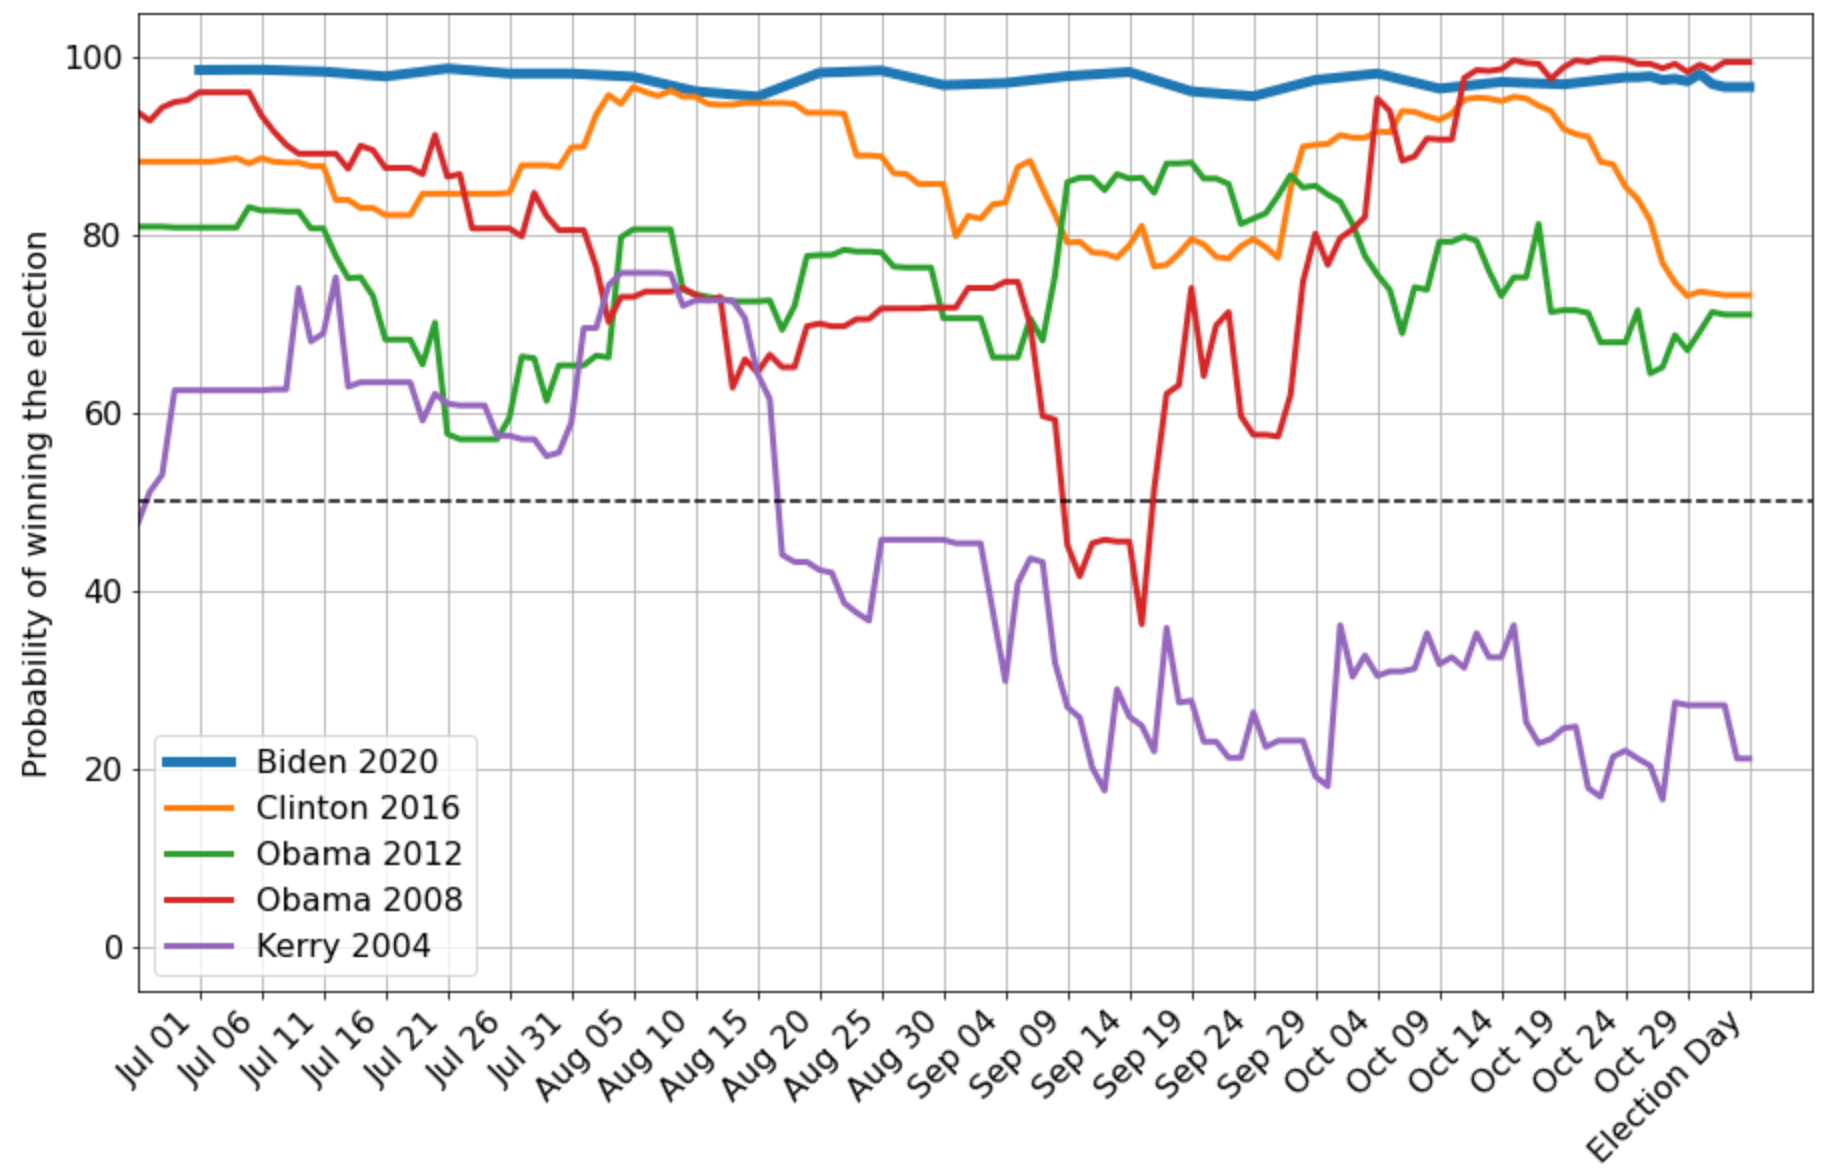
While Hillary's probabilities got quite high around mid-October, they were below Biden's numbers on the same dates and her graph was much less stable and prone to move with different news coming out (e.g. FBI opening an investigation into her). Biden's numbers remain quite stable since at least July and as we head into Election Day his numbers are in Obama 2008 territory. It looks like no "October surprise" was able to move Biden's numbers.
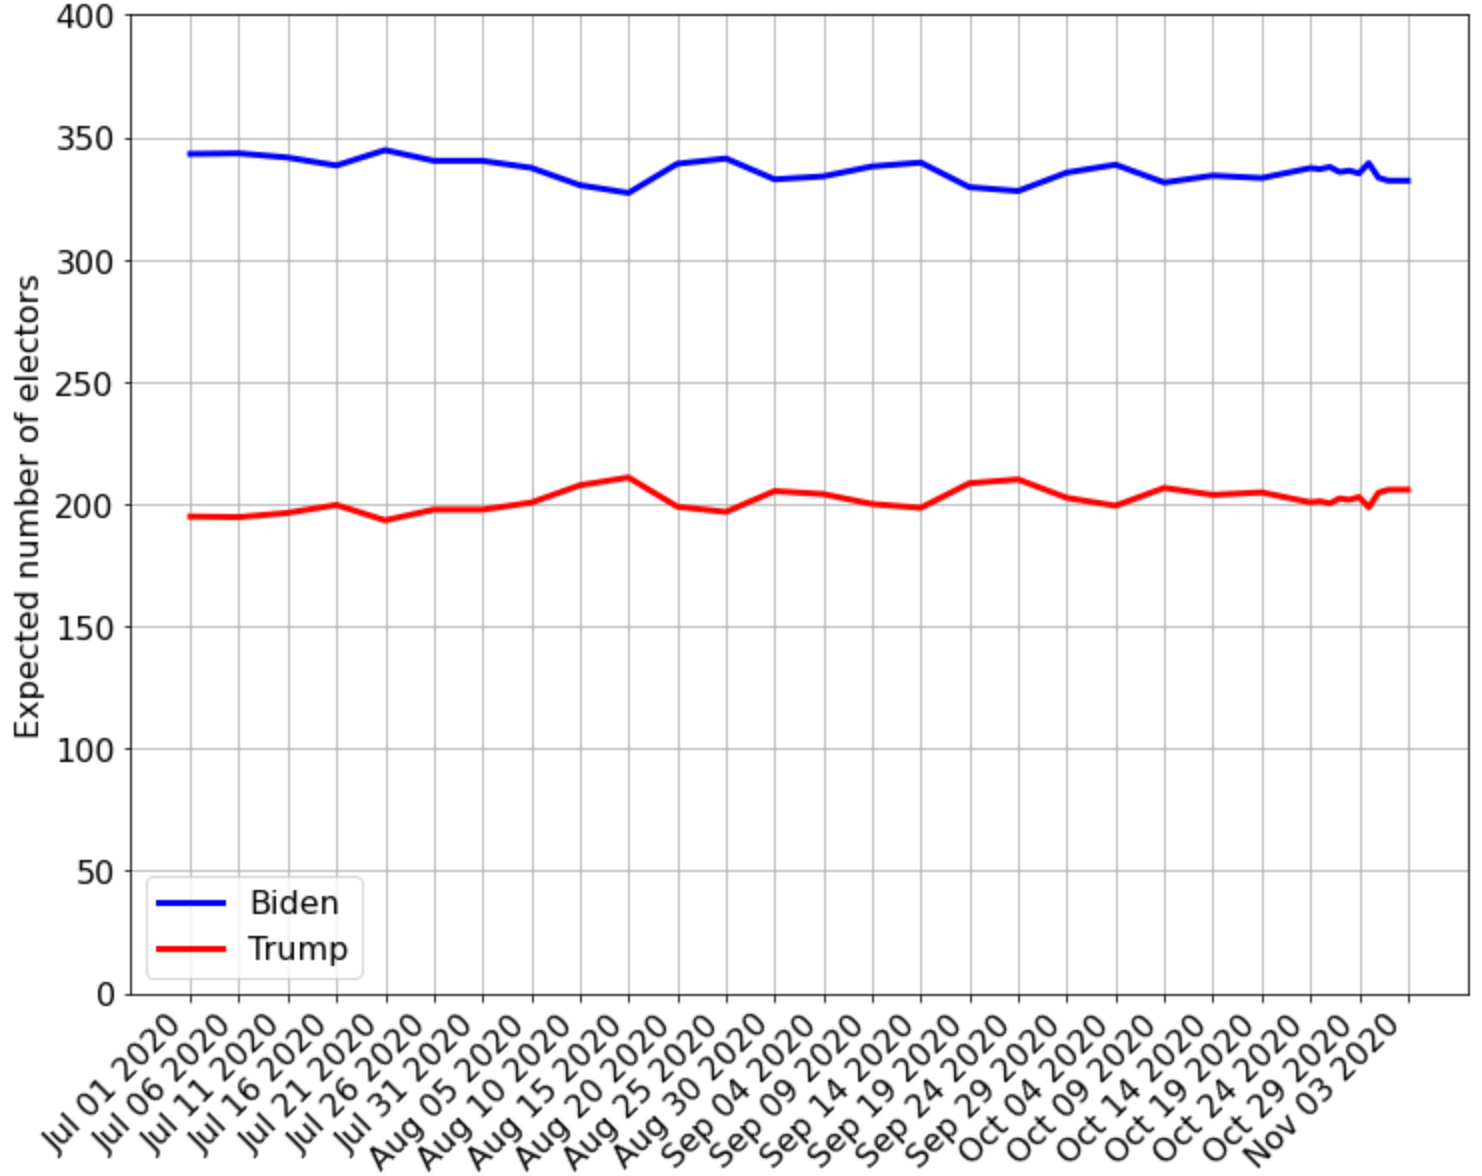
In addition to looking at probabilities of Clinton or Trump winning, we can also look at the probabilities of achieving different electoral vote results. That is, what is the probability that Clinton or Trump will collect say, 270, 285, or 300 electoral votes? (Note that the probability of either of them winning the election is the probability that they will collect 270 or more electoral votes).
The figure on the left shows the probabilities of each of the candidates achieving given electoral vote totals, which vary from zero to 538. The points where the curves are the highest correspond to the most likely electoral votes for each candidate.
As of November 8th, the most likely electoral vote outcome is 289 for Clinton and 249 for Trump.
It is also instructive to see how sensitive this probability is to changes in state poll results. That is, which states impact the result the most if their polls change in favor of one candidate or another?
In the figure on the left, we see the resulting probability of an Clinton win, given changes in state polls from the five states with the most potential upside for Clinton or downside for Trump.
To keep the figure easy to read, it only includes the resulting probability of an Clinton win. The resulting probability of a Trump win is simply 100 minus the probability of an Clinton win.
As of November 8th, Florida, Michigan, Pennsylvania, Virginia, and Wisconsin have the most potential upside for Clinton. If any of their state polls change by 10% in favor of Clinton (i.e. 5% switch from Trump to Clinton in any state), Clinton's probability of winning increases to around 77%-80% and Trump's probability of winning drops to around 20%-23%.
The results in this plot may not be as informative as one would hope, though. This is due to the fact that this plot shows how the resulting probability of winning changes if a particular state's poll results change by a certain amount. But it doesn't capture the likelihood that that state's poll will change by that amount. Therefore, keep this caveat in mind when interpreting the plot.
This figure is similar to the previous one, with the only difference being that it corresponds to changes in state polls from the five states with the most potential downside for Clinton or upside for Trump.
Again, to keep the figure easy to read, it only includes the resulting probability of an Clinton win. The resulting probability of a Trump win is simply 100 minus the probability of an Clinton win.
As of November 8th, Ohio, Georgia, North Carolina, Florida, and Arizona have the most potential downside for Clinton. If any of their state polls change by 10% in favor of Trump (i.e. 5% switch from Clinton to Trump), Clinton's probability of winning decreases to around 65%-67% and Trump's probability of winning jumps to 33%-35%.